What It Does
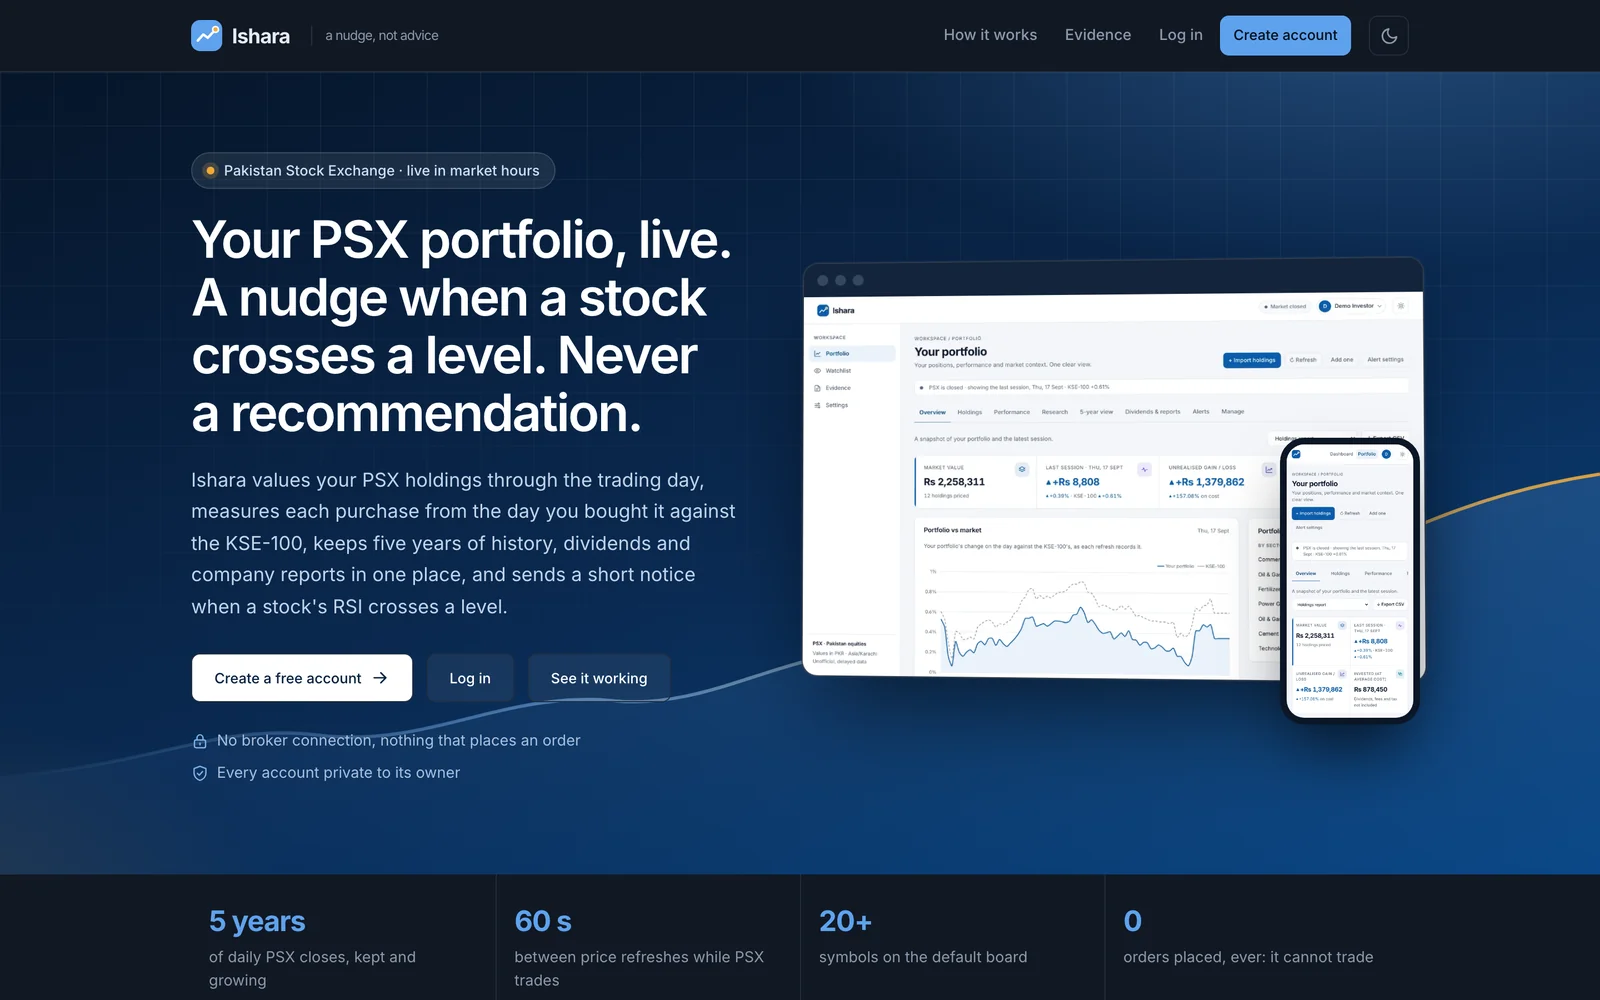
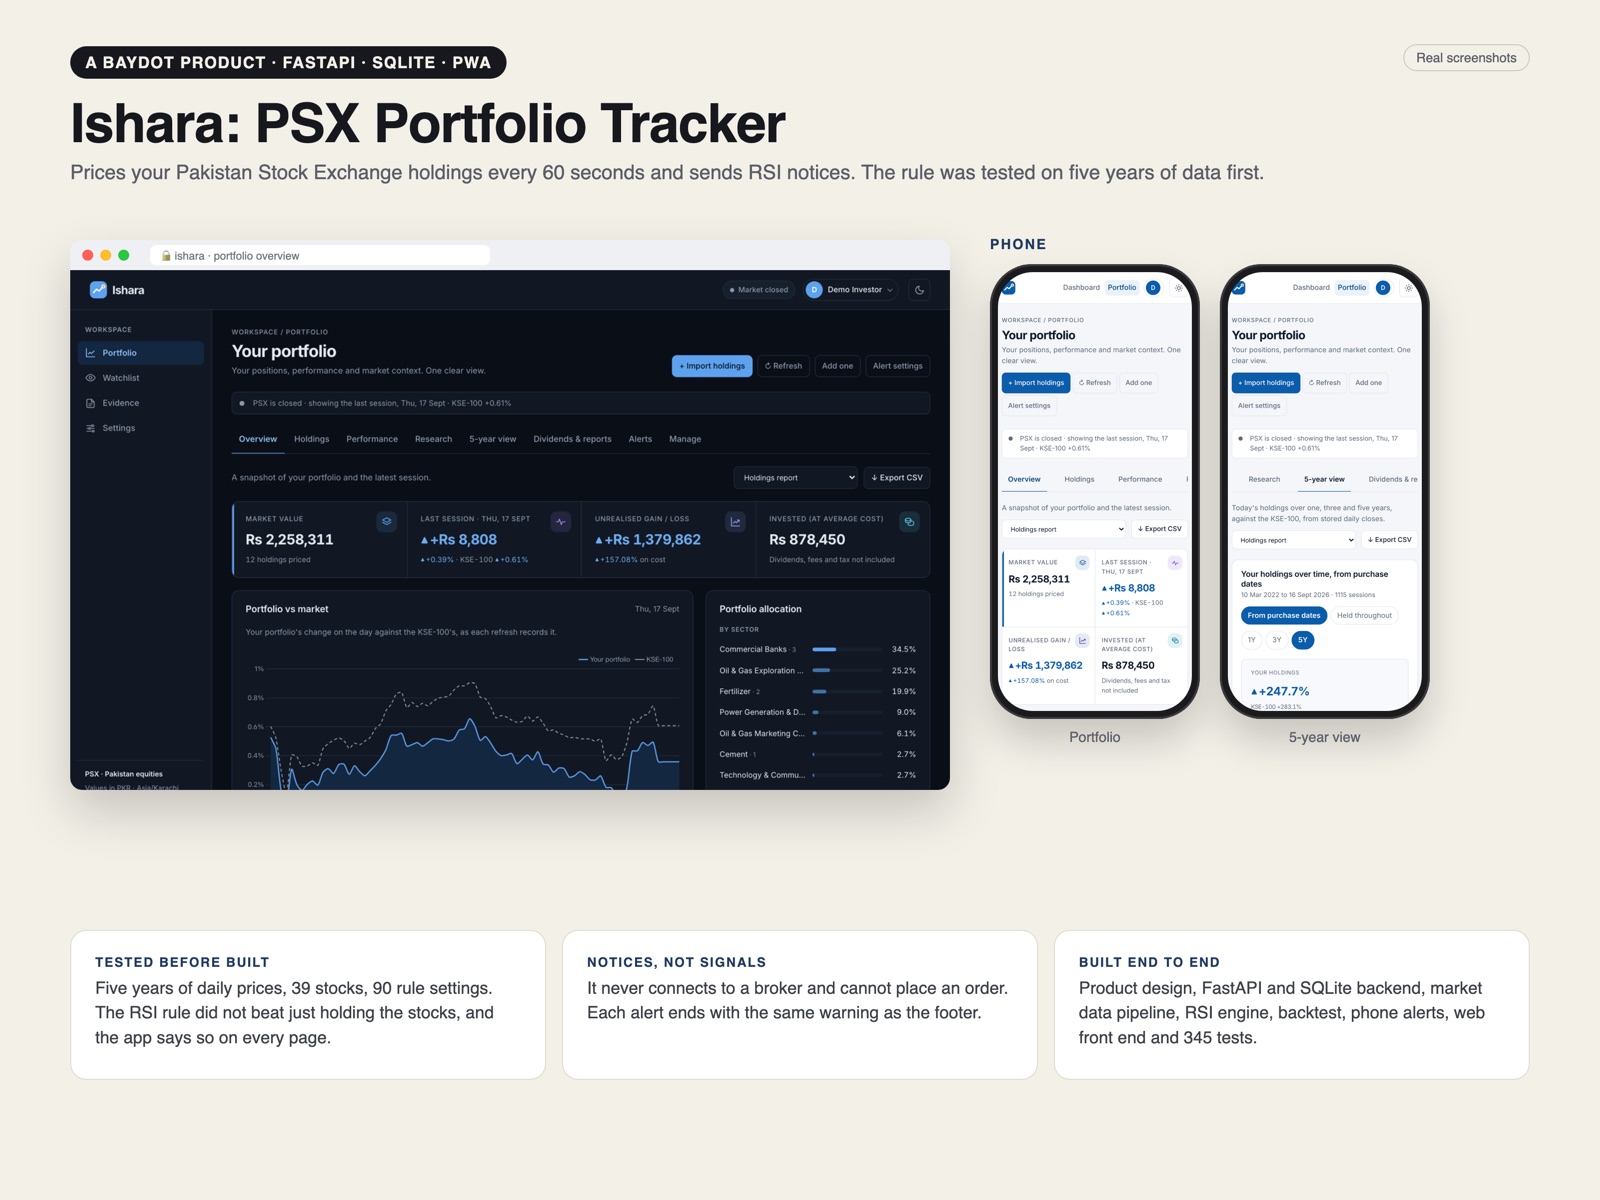
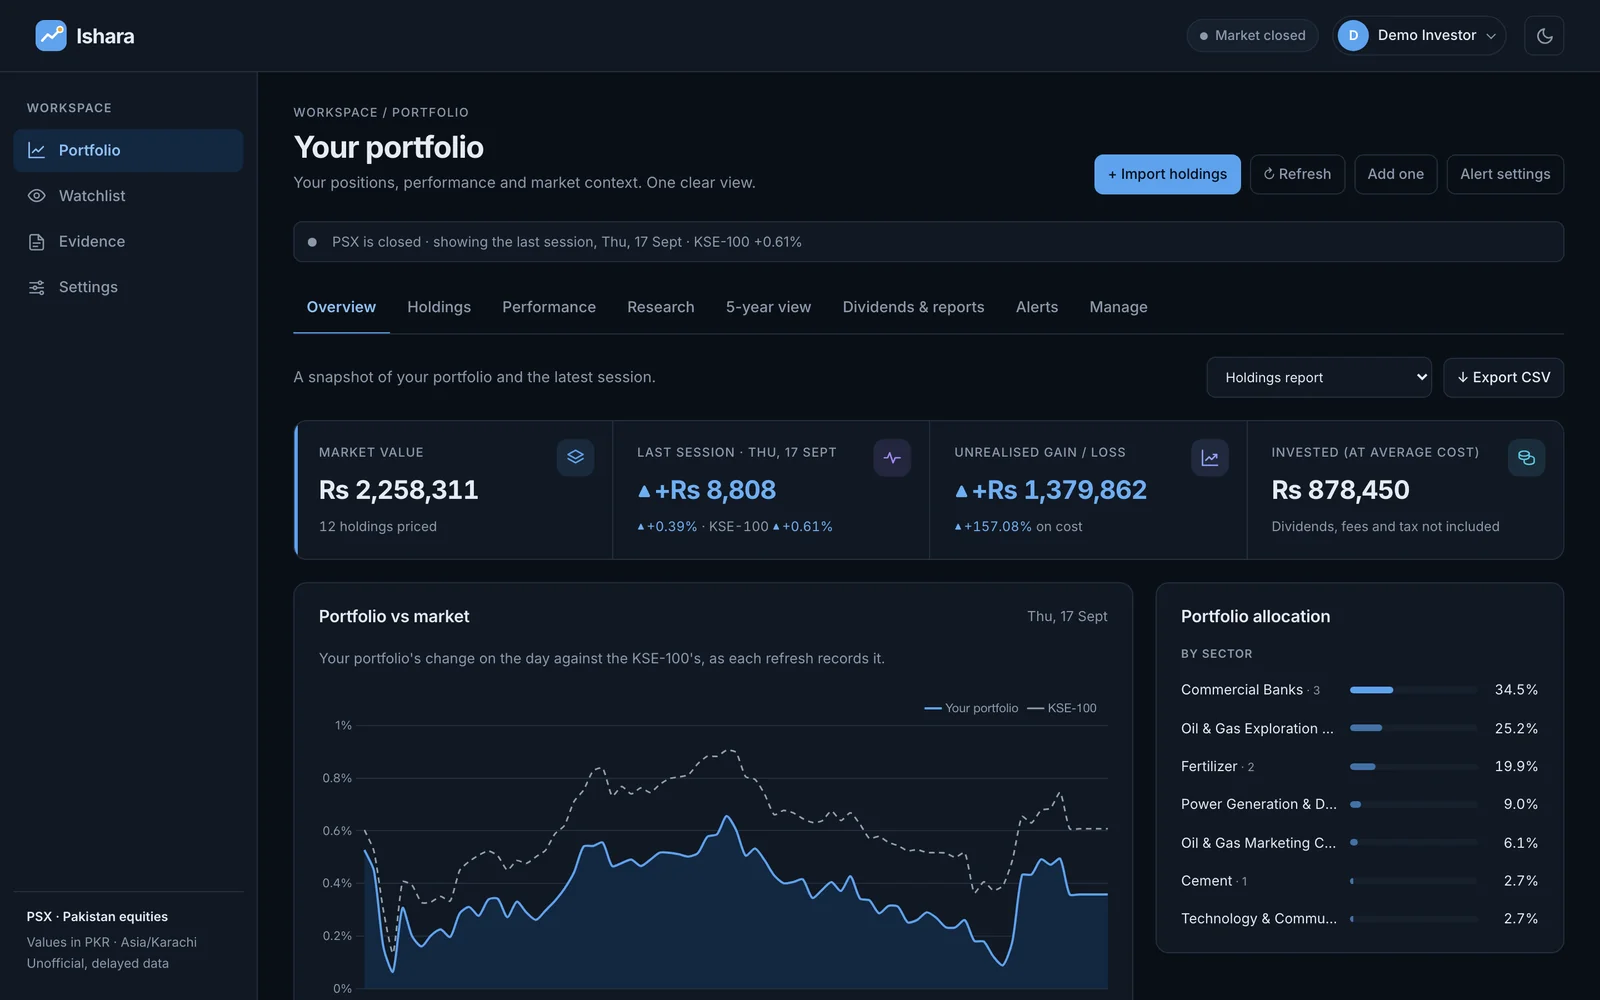
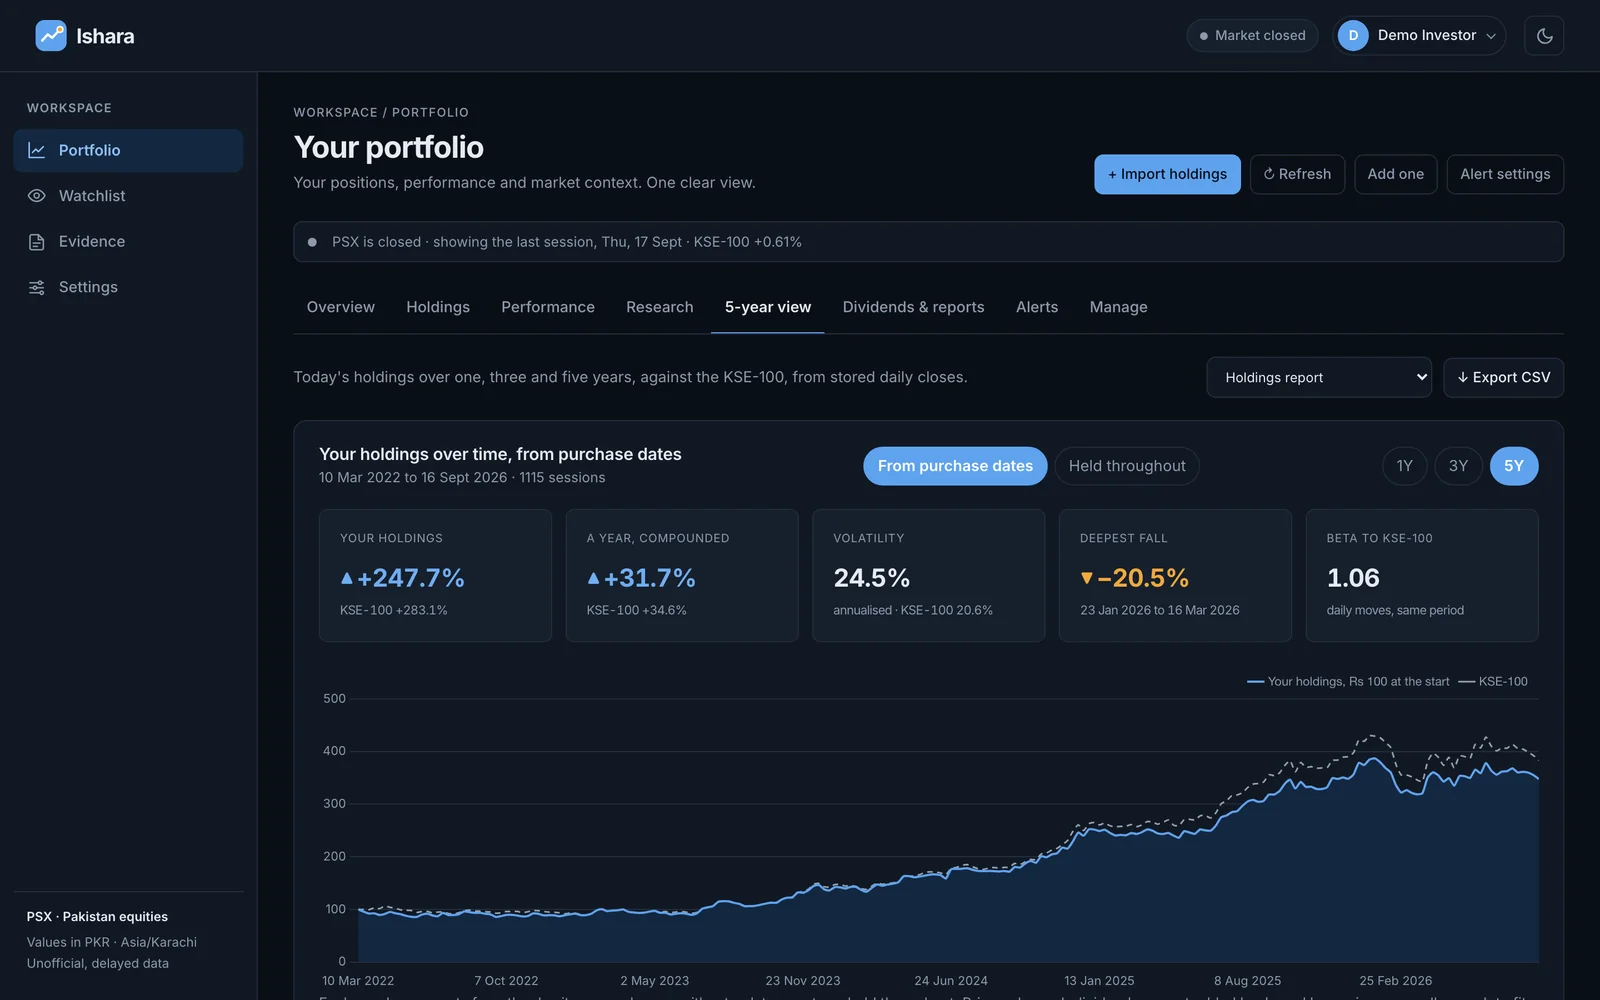
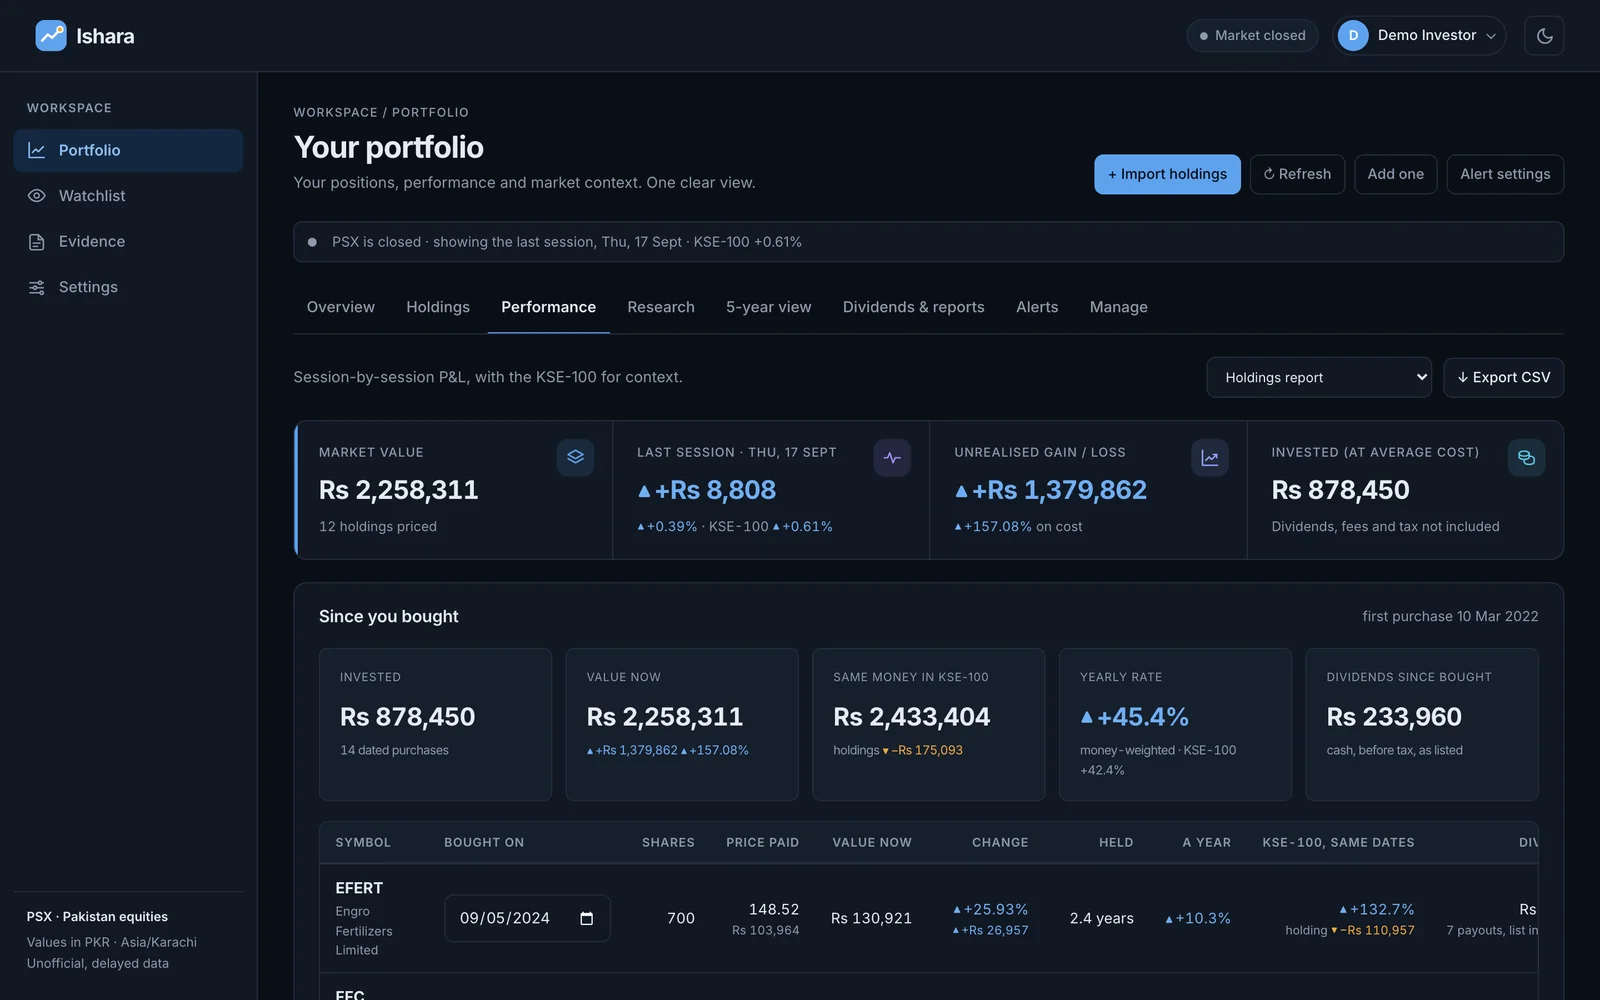
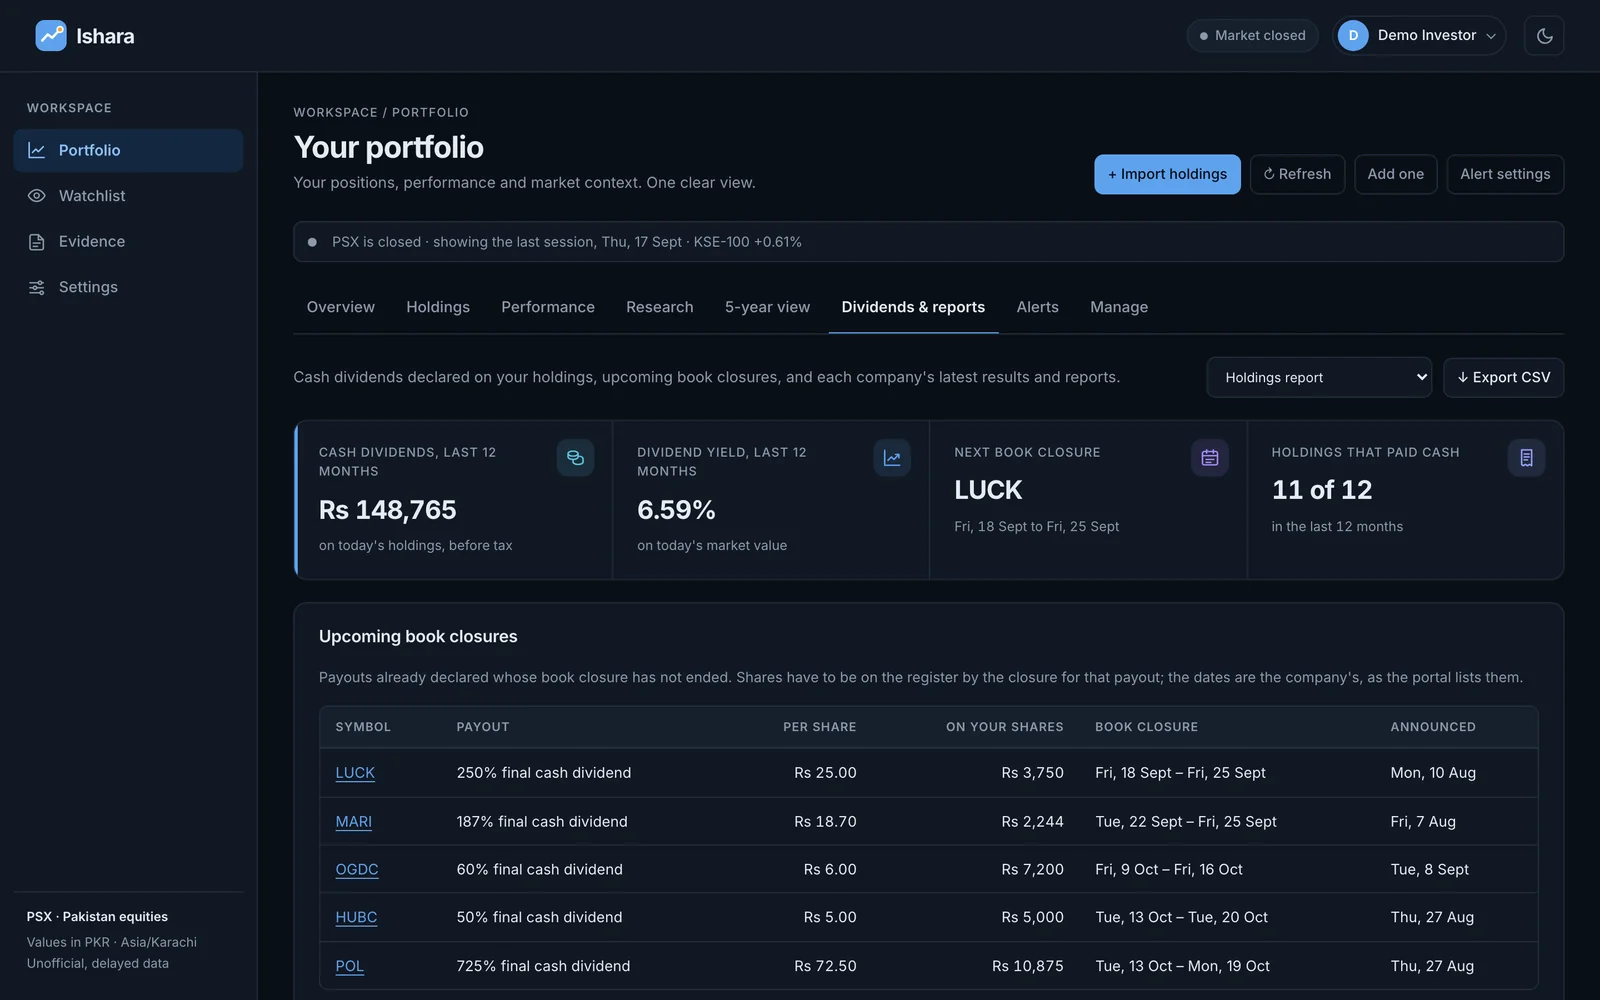
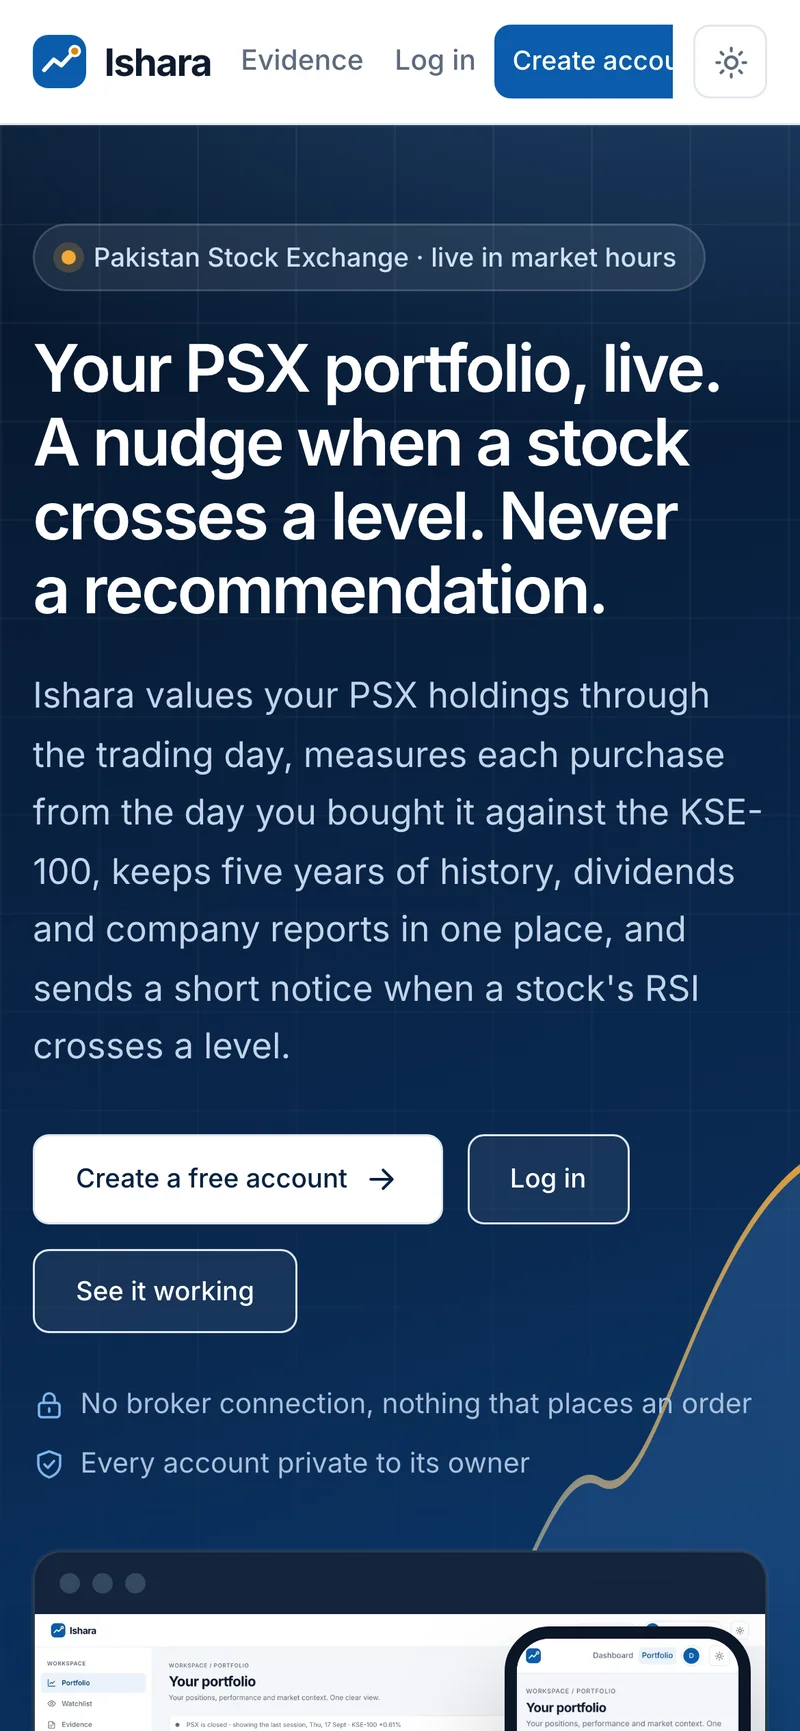
You paste in your holdings. Ishara prices them every 60 seconds while the market is open, from the exchange's own public data portal, so prices are as fresh as that portal is. It compares each purchase with the KSE-100 from the day you bought it, and keeps five years of history, dividends and company reports in one place. When a stock you follow crosses an RSI level on the daily close, you get a short notice on your dashboard and, if you want, on your phone.
It never connects to a broker and it cannot place an order. That is on purpose.
The Honest Part
The first idea was a momentum rule: buy when RSI goes above 70. Before writing a single alert, I tested it on five years of daily prices for 39 liquid PSX stocks. It lost to simply holding the same stocks on 34 of the 39. Tuning did not save it: ninety combinations were tried on one period, and every winner fell apart on a second period it had never seen.
The reverse rule, buying when RSI drops through 40, held up much better on that unseen period. 68% of its trades made money. But it still did not beat simply holding the stocks.
| Unseen period, 1 Jan 2025 to 3 Sep 2026 | Result |
|---|---|
| Just holding the stocks | +27.5% |
| Buy when RSI drops through 40, sell when it gets back to 70 | +25.7% |
| Trades from that rule that made money | 68% of 138 |
| Best momentum rule from the tuning (buy above RSI 65) | +6.3% |
A useful notice is not the same as a proven trading edge.
How these numbers were measured
- A trade counts as a win if it made money after costs. Costs are 0.15% each way.
- A signal comes from the day's closing RSI. The trade happens at the next day's close, so the test never uses a price it could not have known.
- Each percentage is the median stock's total return over the unseen period. Just holding is measured the same way, with the same costs.
- Prices only. Dividends are left out of both numbers.
What this test cannot tell you
- The stocks came from today's KSE-100 list. Companies that dropped out or closed during those five years are missing, and that usually makes any rule look better than it is.
- Thin stocks were removed using their trading volume across all five years, which also leans on information from the future.
- The RSI 40 rule was chosen after looking at the unseen period, so for that rule the period is no longer truly unseen. A third, untouched period would be needed to confirm it.
- 2021 to 2026 was a strong rising market on PSX. Nothing here says how either rule behaves when prices fall.
So Ishara calls these notices, never signals. The evidence is a page inside the app, and the same warning sits in the footer of every page and at the end of every alert. A product that dressed this up as advice would be claiming something its own test contradicts.
How It Is Built
- FastAPI and one SQLite file. No queue, no cache, no build step. Two processes share the database: the web app and a scheduler.
- One module talks to the market data source. If the source changes, one file changes, not the whole app.
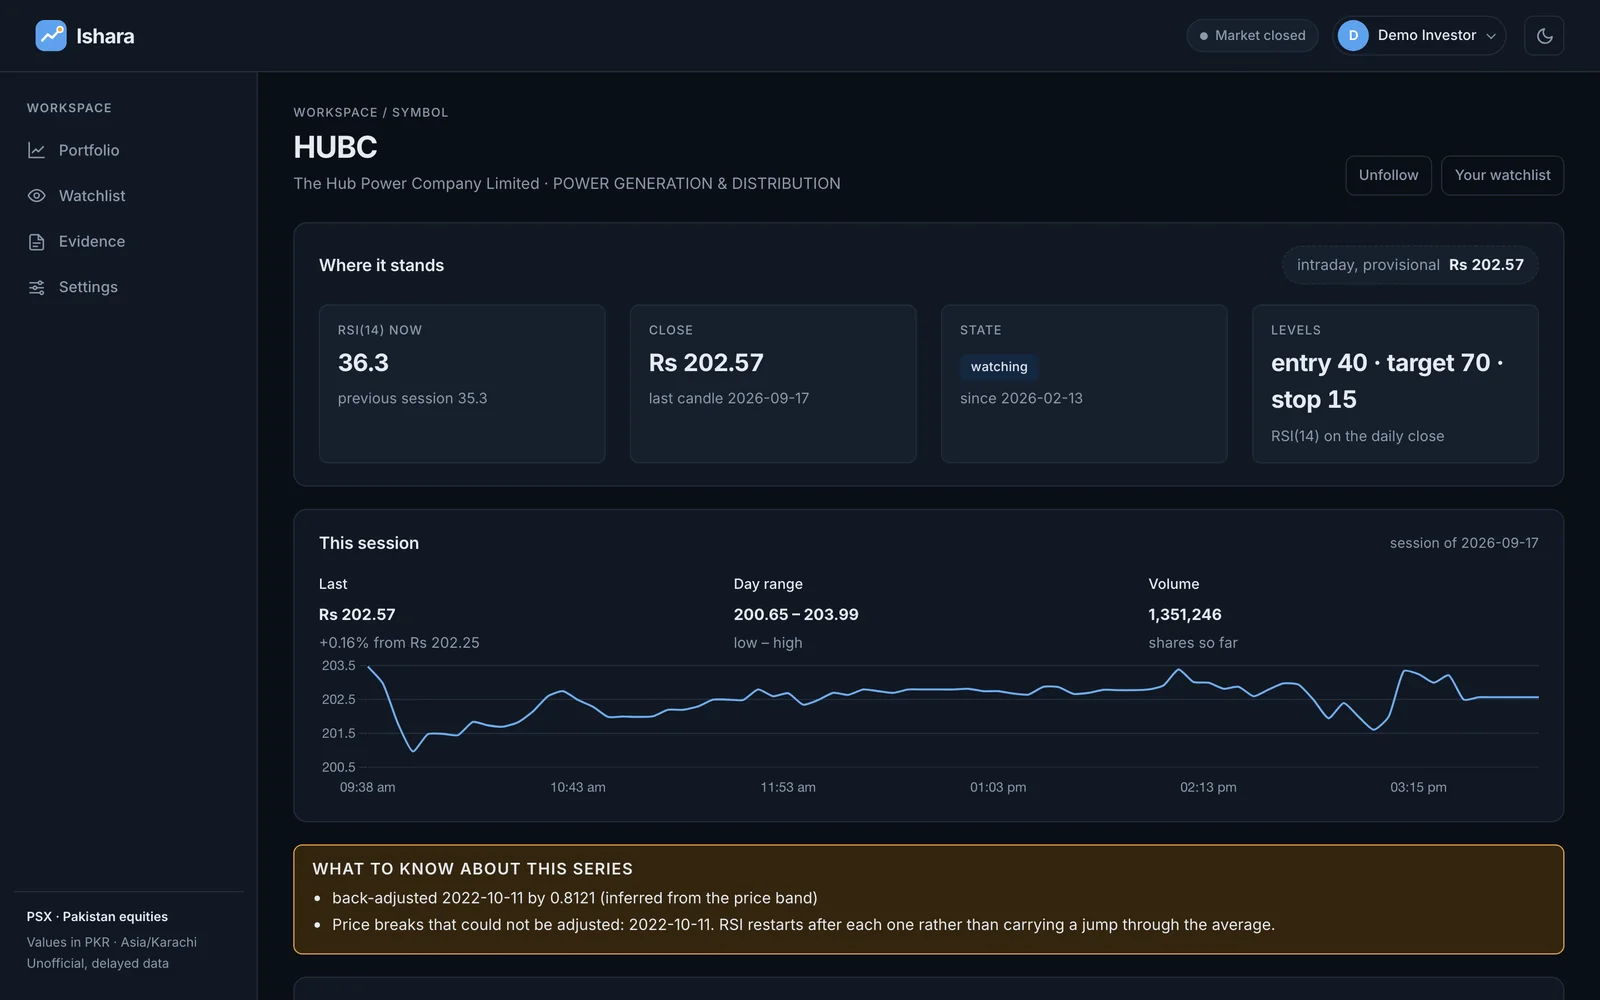
- Price history is cleaned before RSI is worked out. Splits and bonus shares are adjusted, and where a jump cannot be explained, RSI restarts instead of carrying a false spike.
- Market data comes from the exchange's public portal. No login and no paywall: the app reads the same pages a visitor reads, at a visitor's pace, and stores prices only for the people who asked for them.
- Alerts go to the phone through ntfy. Each account picks its own topic. Nothing needs to be installed on the server for it.
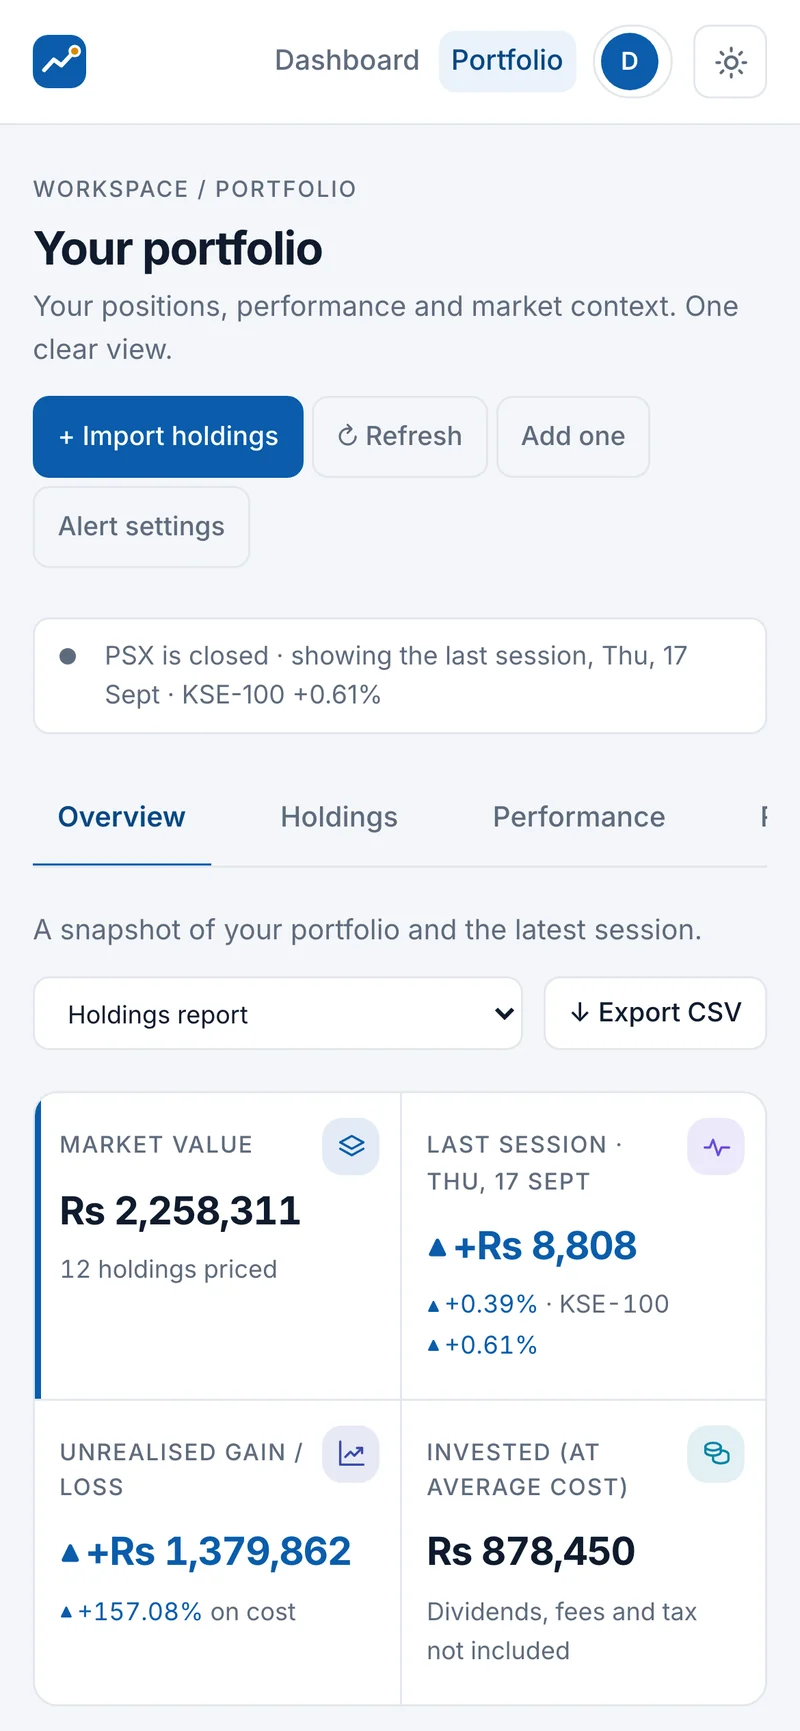
- Light and dark themes, and it works on a phone.
Why It Matters for Your Project
Most dashboards show numbers. This one also tells you when a number should not be trusted. If you are building a finance app, a trading tool or anything that turns data into a decision, that is the part that protects you and your users: test the idea before you build around it, and say plainly what the test found.